

NADA Market Beat
Produced by NADA's Industry Analysis division, NADA Market Beat is a monthly report on U.S. new light vehicle sales; it replaces the NADA Monthly Sales Recap.
NADA Market Beat: End of Q1 2024 SAAR 2.7% Higher than Same Period in 2023
In March 2024, the new light-vehicle sales SAAR was 15.5 million units—an increase of 3.8% compared with March 2023.

In March 2024, the new light-vehicle sales SAAR was 15.5 million units—an increase of 3.8% compared with March 2023. March saw the highest raw sales volume for all of first-quarter 2024, even though the March SAAR was down slightly from February. The first-quarter SAAR was 15.4 million units, an increase of 7% compared with first-quarter 2023.
In March 2024, new-vehicle shoppers had many more vehicles to choose from versus last year. New light-vehicle inventory on the ground and in-transit totaled 2.58 million units, an increase of 40.2% compared with March 2023. As vehicle inventory and OEM incentives have risen, average transaction prices have fallen. According to J.D. Power, average incentive spending per unit should total $2,800 in March 2023—a year-over-year increase of 66.6%. And the average new-vehicle transaction price in March 2024 is expected to total $44,186, down 3.6% compared with March of last year.
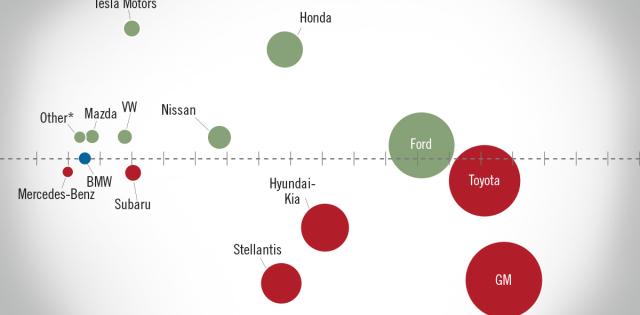
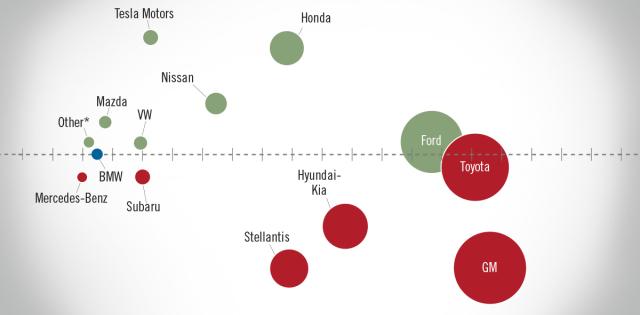
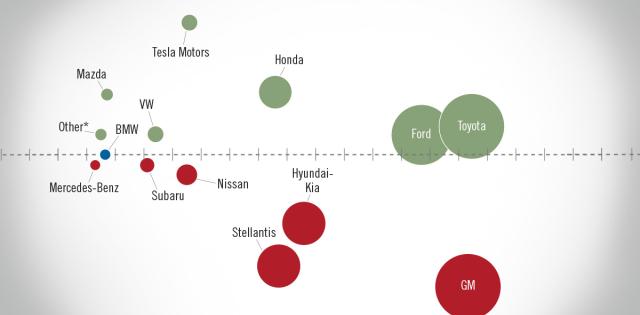
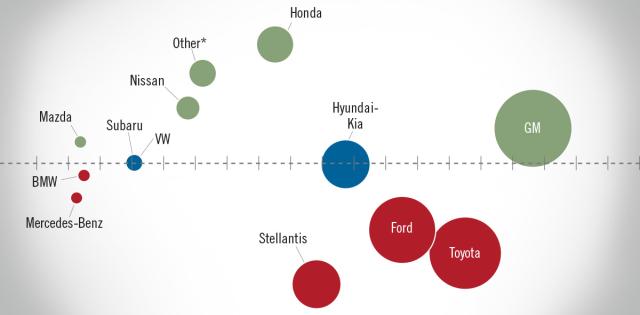
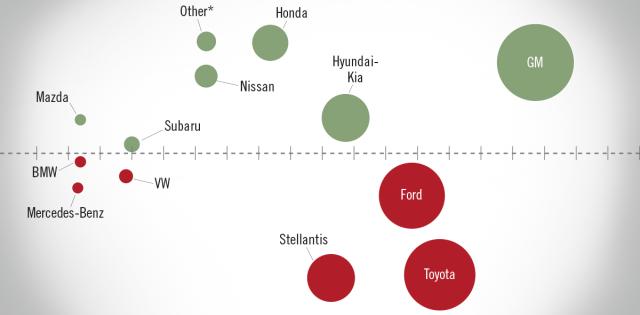
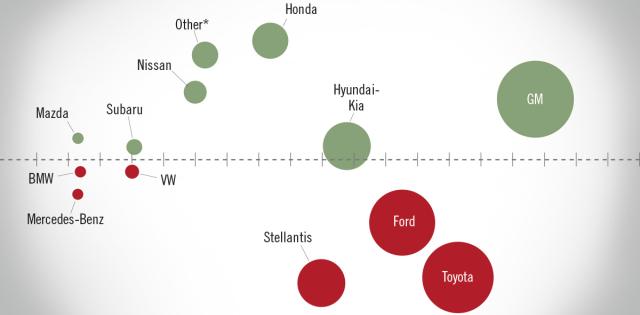
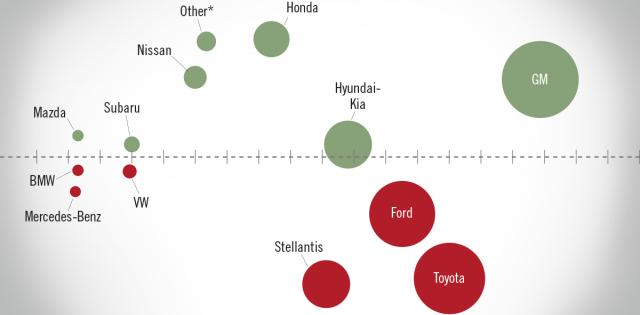
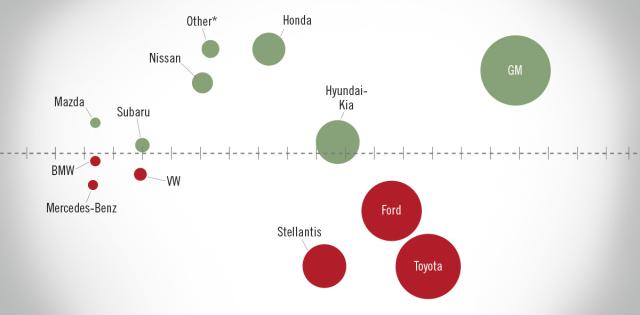
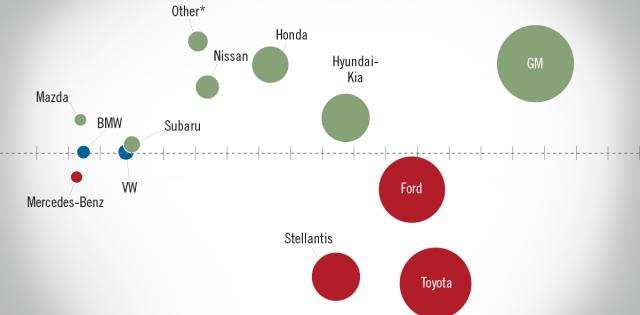
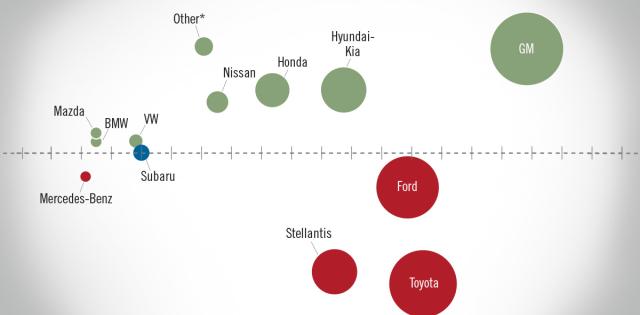
In first-quarter 2024, alternative-fuel vehicles represented 18% of all new vehicles sold. Conventional hybrids, which were 8.6% of new-vehicle sales during this period, have had the largest gain in market share—an increase of 2.4 percentage points year-over-year. Battery electric vehicles (BEVs) and plug-in hybrid vehicles (PHEVs) gained market share as well, but to a lesser degree than conventional hybrids. In first-quarter 2024, the BEV market share was 7.1% and PHEV market share was 2.3%—year-over-year increases of 0.2 and 0.8 percentage points respectively.
Looking ahead, we expect inventory to increase and then plateau in the second quarter before rising again in the fourth quarter. We also anticipate inventory will total some 2.7 million to 2.8 million units heading into 2025. Overall, with sales volumes likely rising throughout the year, our new-vehicle sales forecast is for 15.9 million units for all of 2024.
2024
April NADA Market Beat: End of Q1 2024 SAAR 2.7% Higher than Same Period in 2023 February NADA Market Beat: February 2024 New Light-Vehicle Sales Finish Strong January NADA Market Beat: 2024 Starts with 15 Million Unit SAAR2023 Archives
December NADA Market Beat: 2023 New Light-Vehicle Sales Reach 15.46 Million Units November NADA Market Beat: New Light-Vehicle Inventory Reaches 20-Month High October NADA Market Beat: New Light-Vehicle SAAR Continues Hot Streak September NADA Market Beat: 13th Straight Month of Year-over-Year New Light-Vehicle Sales Increases August NADA Market Beat: New Light-Vehicle Sales YTD Up 13.7% YOY July NADA Market Beat: New Light-Vehicle Sales Increase Year-Over-Year for 11 Straight Months June NADA Market Beat: First Half of 2023 Hits High Note with June 2023 15.7 Million Unit SAAR May NADA Market Beat: May 2023 is 10th Consecutive Month of YOY Sales Increases April NADA Market Beat: April 2023 New Light-Vehicle SAAR Increases 11.4% Compared to April 2022 February NADA Market Beat: New Light-Vehicle SAAR Up Year-Over-Year for Seventh Straight Month January NADA Market Beat: January 2023 SAAR Hits 15.7 Million Units2022 Archives
December NADA Market Beat: 2022 New Light-Vehicle Sales top 13.7 Million Units November NADA Market Beat: November 2022 New Light-Vehicle Sales Up YOY; Down Slightly from Month Prior October October New Light-Vehicle Sales Up Nearly 10% from September September NADA Market Beat: September 2022 New Light-Vehicle Sales Up 9.6% August NADA Market Beat: August 2022 New Light-Vehicle SAAR Up 0.7% Year-Over-Year July NADA Market Beat: New-Light Vehicle Sales Increased Slightly Month-Over-Month June NADA Market Beat: June New Light-Vehicle Sales Up Slightly from May 2022 But Down Year-Over-Year May New Light-Vehicle Sales Down 12.6% Month-Over-Month April NADA Market Beat: April New Light-Vehicle Sales Up Slightly from March March NADA Market Beat: Supply Chain Disruptions Suppress New Light-Vehicle Sales February NADA Market Beat: February New Light-Vehicle Sales Weakened Compared to January January NADA Market Beat: January 2022 New Light-Vehicle SAAR Reaches 7 Month High2021 Archives
December NADA Market Beat: 2021 New Light-Vehicle Sales Up 3.1% over 2020 November NADA Market Beat: Limited Vehicle Availability Continues to Impact Sales Despite Slight Inventory Increases in November October NADA Market Beat: First Monthly New Light-Vehicle Sales Gain Since April September NADA Market Beat: Limited Inventory Drives SAAR of 12.2 Million Units for September Sales August NADA Market Beat: New Vehicle Sales Decline Amid Inventory Constraints July NADA Market Beat: Inventory Continues to Impact New-Vehicle Sales June NADA Market Beat: Inventory Constraints Limit New-Car Sales April NADA Market Beat: New Light Vehicle-Sales Top 18 Million Unit SAAR for Second Straight Month March NADA Market Beat: March New Light-Vehicle Auto Sales Incredibly Strong February NADA Market Beat: New Light-Vehicle Sales Fall Slightly in February January NADA Market Beat: Light-Vehicle Sales Start Strong in January 20212020 Archives
December NADA Market Beat: 2020 Light-Vehicle Sales Reach 14.46 Million Units November NADA Market Beat: New-Vehicle Sales Down Slightly Compared to Previous Two Months October NADA Market Beat: New-Vehicle Sales Top 16 Million Unit SAAR for Second Straight Month September NADA Market Beat: New Light-Vehicle Sales Up for Fifth Consecutive Month August NADA Market Beat: New Light-Vehicle Sales Continue to Recover July NADA Market Beat: July Vehicle Sales Improve for Third Consecutive Month June NADA Market Beat: June Vehicle Sales Increased to 13 Million SAAR May NADA Market Beat: May Sales Show Signs of Recovery April NADA Market Beat: April 2020 SAAR Falls to 8.6 Million Units March NADA Market Beat: Light Vehicle Sales Down 34.1% in March Due to COVID-19 February NADA Market Beat: U.S. New Vehicle Sales Up 1.9% Year-Over-Year January NADA Market Beat: Light Trucks Represent 75% of All Light Vehicles Sold2019 Archives
December NADA Market Beat: 2019 U.S. New Vehicle Sales Mark 5th Year Over 17 Million Units November NADA Market Beat: U.S. New Vehicle Sales Down 1.5% Year-to-Date October NADA Market Beat: U.S. New Vehicle Sales Down 1.5% Year-to-Date September NADA Market Beat: U.S. New Vehicle Sales Down 1% Year-to-Date August NADA Market Beat: U.S. New Vehicle Sales Down 1.1% Year-to-Date July NADA Market Beat: U.S. New Vehicle Sales Down 1.4% Year-to-Date June NADA Market Beat: U.S. New Vehicle Sales Down 1.2% Year-to-Date May NADA Market Beat: Despite a Solid May Sales Performance, U.S. Light-Vehicle Sales Down 1.8% Year-to-Date April NADA Market Beat: U.S. Light-Vehicle Sales Down 4.5% March NADA Market Beat: U.S. Light-Vehicle Sales Down 0.9% February NADA Market Beat: U.S. Light-Vehicle Sales Down 2.5% January NADA Market Beat: U.S. Light-Vehicle Sales Down 3%Related

NADA Show 2025

The Auto Industry Event of the Year returns to New Orleans, Jan 23-26.